10.67 Target as a Factor
20180726 We often build classification models. For such models we want to ensure the target is categoric. Often it is 0/1 and hence is loaded as numeric. We could tell our model algorithm of choice to explicitly do classification or else set the target using base::as.factor() in the formula. Nonetheless it is generally cleaner to do this here and note that this code has no effect if the target is already categoric.
# Ensure the target is categoric.

ds[[target]] %<>% as.factor()

# Confirm the distribution.

ds[target] %>% table()
## rain_tomorrow
## no yes
## 158277 44289We can visualise the distribution of the target variable using
ggplot2 (Wickham et al. 2025). The dataset is piped to
ggplot2::ggplot() whereby the target is associated through
ggplot2::aes_string() (the aesthetics) with the x-axis of the
plot. To this we add a graphics layer using
ggplot2::geom_bar() to produce the bar chart, with bars having
width= 0.2 and a fill= color of
"grey". The resulting plot can be seen in
Figure @ref(fig:data:plot_target_distribution).
ds %>%
  ggplot(aes_string(x=target)) +
  geom_bar(width=0.2, fill="grey") +
  theme(text=element_text(size=14))
## Warning: `aes_string()` was deprecated in ggplot2 3.0.0.
## ℹ Please use tidy evaluation idioms with `aes()`.
## ℹ See also `vignette("ggplot2-in-packages")` for more information.
## This warning is displayed once every 8 hours.
## Call `lifecycle::last_lifecycle_warnings()` to see where this warning was generated.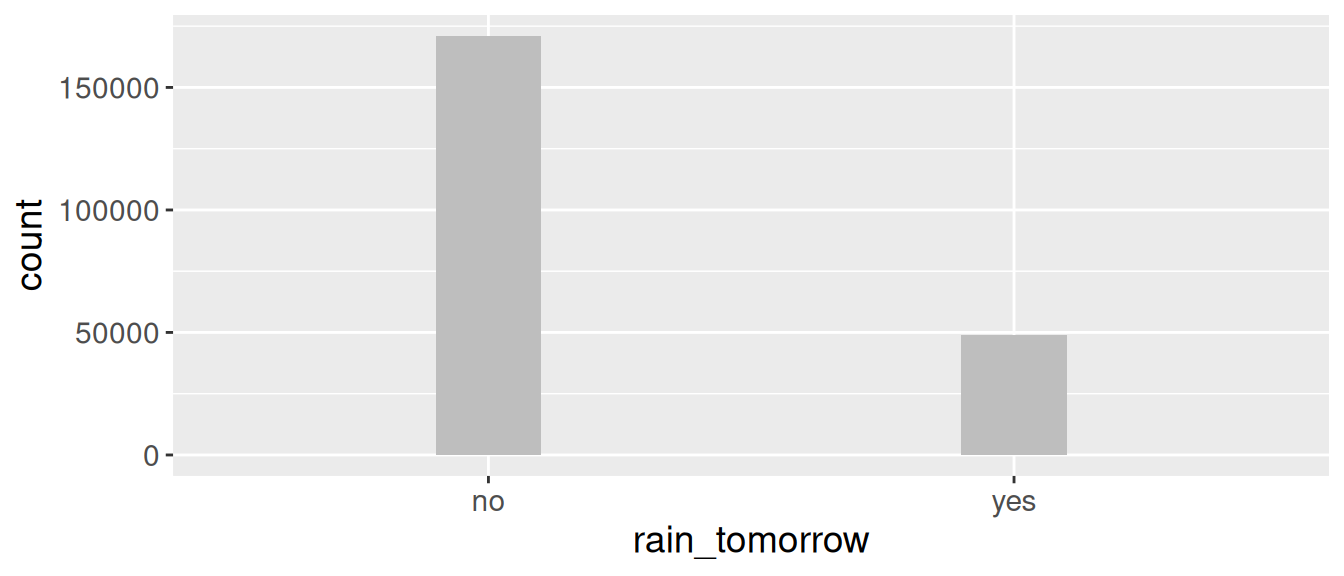
(#fig:data:plot_target_distribution)Target variable distribution. Plotting the distribution is useful to gain an insight into the number of observations in each category. As is the case here we often see a skewed distribution.
References
Your donation will support ongoing availability and give you access to the PDF version of this book. Desktop Survival Guides include Data Science, GNU/Linux, and MLHub. Books available on Amazon include Data Mining with Rattle and Essentials of Data Science. Popular open source software includes rattle, wajig, and mlhub. Hosted by Togaware, a pioneer of free and open source software since 1984. Copyright © 1995-2022 Graham.Williams@togaware.com Creative Commons Attribution-ShareAlike 4.0
