11.24 Benford Plot
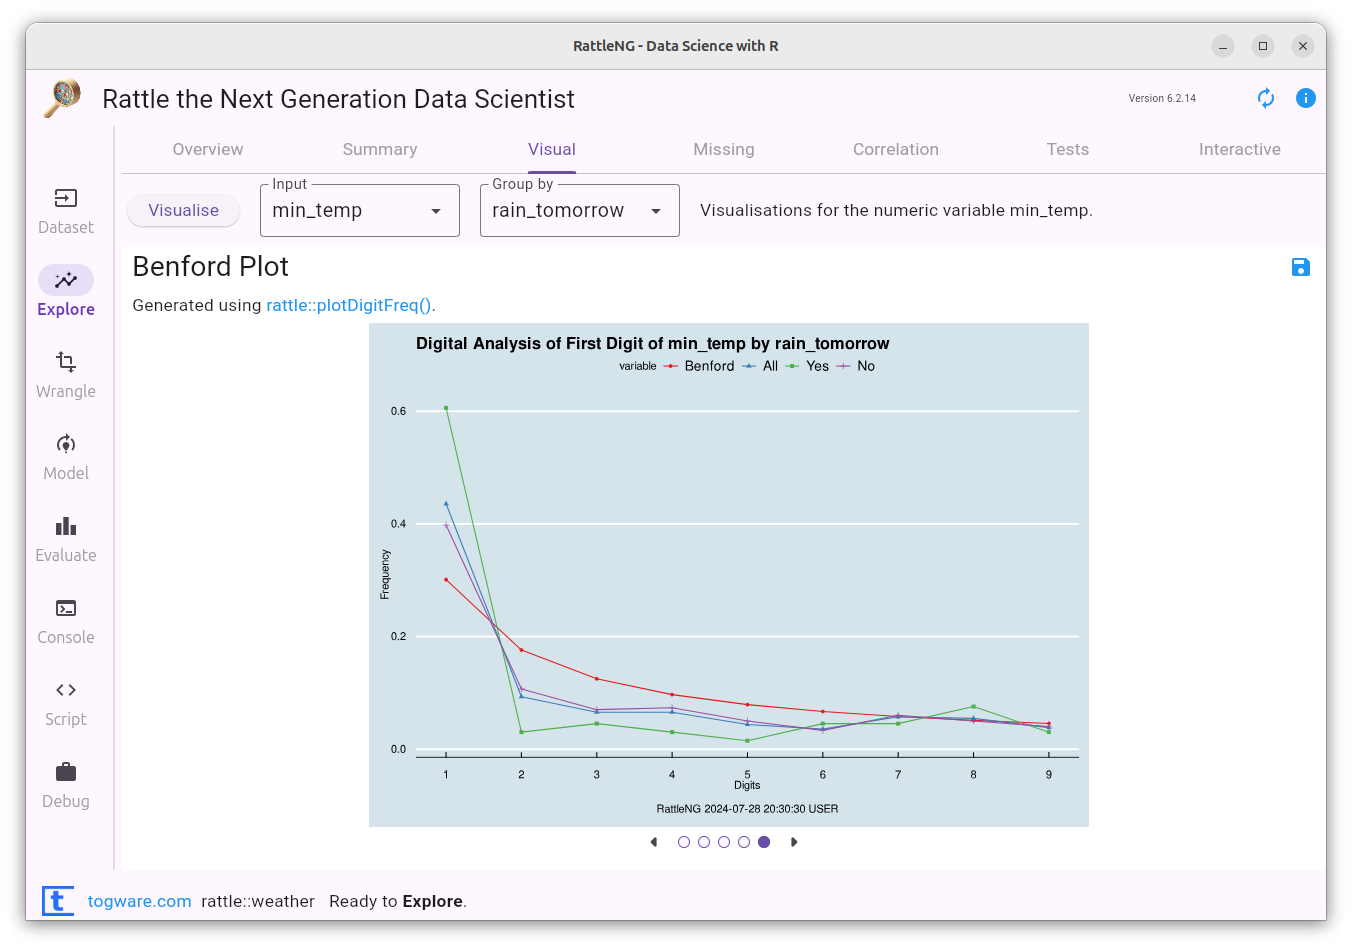
A Benford Plot uses Benford’s Law which has proven to be effective in identifying oddities in data, for example in fraud detection. Benford’s law relates to the frequency of occurrence of the first digit in a collection of numbers. In many cases, the digit ‘1’ appears as the first digit of the numbers in the collection some 30% of the time, whilst the digit ‘9’ appears as the first digit less than 5% of the time. This rather startling observation is certainly found empirically to hold in many collections of numbers, such as bank account balances, taxation refunds, stock prices, death rates, lengths of rivers. Indeed it is observed for processes described by power laws which are common in nature. By plotting a collection of numbers against the expectation as based on Benford’s law, we are able to quickly see any odd behaviour in the data.
Benford’s law is not valid for all collections of numbers. For example, people’s ages would not be expected to follow Benford’s Law, nor would telephone numbers. So use the observations with care.
If you find this curated material useful then you can consider a donation to support it's ongoing availability and give you access to the PDF version of this book. The material has been scoped up by Generative AI without permission or any kind of recompense so do consider a donation if you can afford it. Unlike Generative AI your access to this materials is freely given. Desktop Survival Guides include Data Science, GNU/Linux, and MLHub. Books available on Amazon include Data Mining with Rattle and Essentials of Data Science. Togaware has a 30 year tradition of making popular open source software which includes sold privacy preserving productivity apps, rattle, wajig, and mlhub. Hosted by Togaware, a pioneer of free and open source software since 1984. Copyright © 1995-2022 Graham.Williams@togaware.com Creative Commons Attribution-ShareAlike 4.0