20.3 Rattle Startup
After starting R (perhaps via RStudio) we can start up (G. Williams 2022), a graphical user interface for the data scientist, from the R Console prompt. Simply load the package then invoke the rattle::rattle() command, as in:
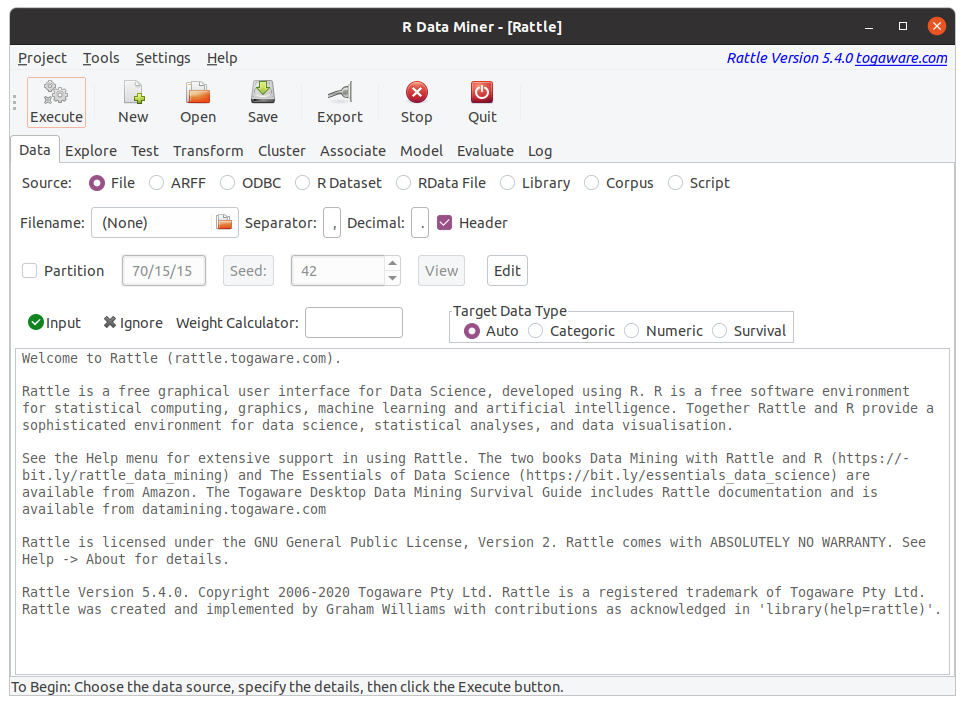
The above Rattle window will display, ready to load data, explore and test the data, transform the data, and then begin building models from the data.
The interface aims to be simple and easy to use. The row of buttons support the basic operations, particularly the Execute button which we click so that the particular tab setting take effect or its associated operation is performed. Below the buttons are a series of tabs that represent the major steps of a data science project. In general we work through the tabs from the left to right, loading some data, exploring and testing the data, performing some transformations on the data, doing a cluster and/or association analysis, building a predictive model, and evaluating the performance of the model.
After setting up the requirements and settings for a particular tab, be sure to click the Execute button to have the settings within tab take effect, or else perform the task associated with the tab.
References
Your donation will support ongoing availability and give you access to the PDF version of this book. Desktop Survival Guides include Data Science, GNU/Linux, and MLHub. Books available on Amazon include Data Mining with Rattle and Essentials of Data Science. Popular open source software includes rattle, wajig, and mlhub. Hosted by Togaware, a pioneer of free and open source software since 1984. Copyright © 1995-2022 Graham.Williams@togaware.com Creative Commons Attribution-ShareAlike 4.0
