21.26 Plotting Word Frequencies
We can generate the frequency count of all words in a corpus:
##      data      mine       use   pattern   dataset       can     model   cluster
##      3101      1446      1366       887       776       709       703       616
## algorithm      rule    featur       set      tree    method
## 611 609 578 555 547 544## word freq
## data data 3101
## mine mine 1446
## use use 1366
## pattern pattern 887
## dataset dataset 776
## can can 709We can then plot the frequency of those words that occur at least 500 times in the corpus:
subset(wf, freq>200)                                                  %>%
  ggplot(aes(word, freq))                                              +
  geom_bar(stat="identity")                                            +
  theme(axis.text.x=element_text(angle=45, hjust=1))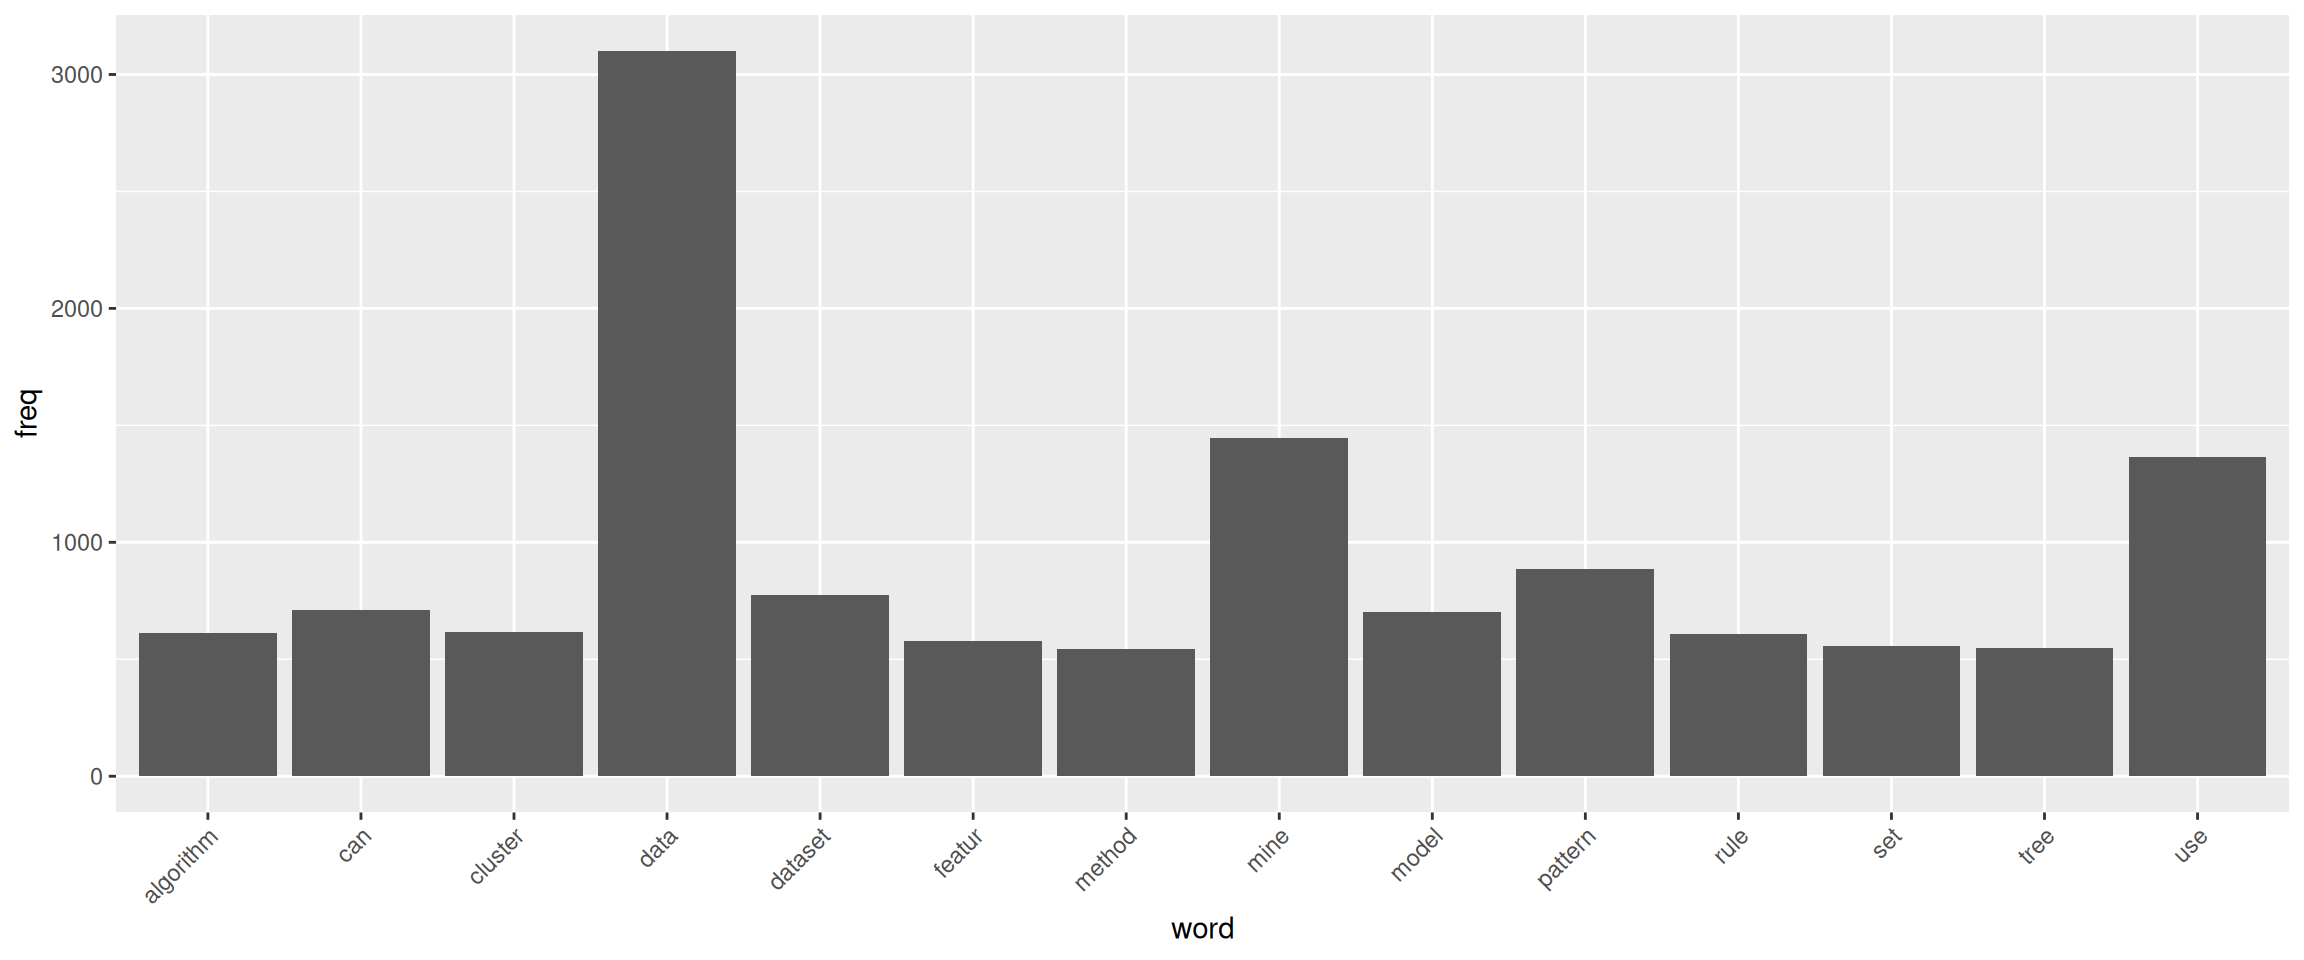
Your donation will support ongoing availability and give you access to the PDF version of this book. Desktop Survival Guides include Data Science, GNU/Linux, and MLHub. Books available on Amazon include Data Mining with Rattle and Essentials of Data Science. Popular open source software includes rattle, wajig, and mlhub. Hosted by Togaware, a pioneer of free and open source software since 1984. Copyright © 1995-2022 Graham.Williams@togaware.com Creative Commons Attribution-ShareAlike 4.0
