21.24 Correlations Plots
(Hansen et al. 2024) from the BioConductor repository for R
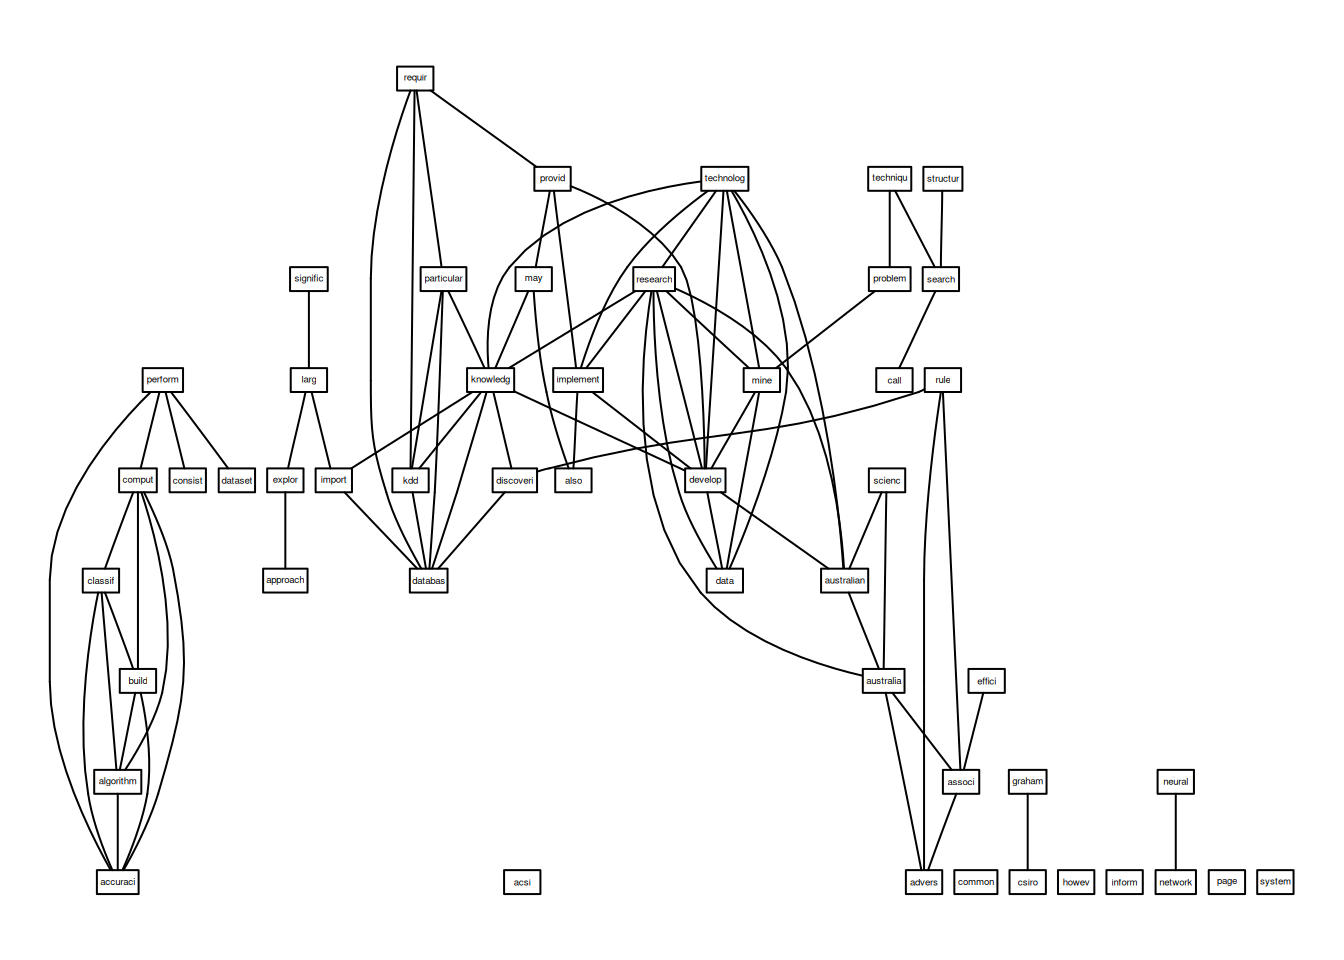
(bioconductor.org) is used to plot the network graph that
displays the correlation between chosen words in the corpus. Here we
choose 50 of the more frequent words as the nodes and include links
between words when they have at least a correlation of 0.5.
By default (without providing terms and a correlation threshold) the plot function chooses a random 20 terms with a threshold of 0.7.
References
Hansen, Kasper Daniel, Jeff Gentry, Li Long, Robert Gentleman, Seth Falcon, Florian Hahne, and Deepayan Sarkar. 2024. Rgraphviz: Provides Plotting Capabilities for r Graph Objects. https://doi.org/10.18129/B9.bioc.Rgraphviz.
Your donation will support ongoing availability and give you access to the PDF version of this book. Desktop Survival Guides include Data Science, GNU/Linux, and MLHub. Books available on Amazon include Data Mining with Rattle and Essentials of Data Science. Popular open source software includes rattle, wajig, and mlhub. Hosted by Togaware, a pioneer of free and open source software since 1984. Copyright © 1995-2022 Graham.Williams@togaware.com Creative Commons Attribution-ShareAlike 4.0
