11.23 Bar Chart Showcase Solar
20210413
solar %>%
ggplot(aes(x=date, y=amount, fill=item)) +
geom_col(position="dodge") +
geom_label(aes(label=amount), vjust=-0.2, show.legend=FALSE,
position=position_dodge(width=0.9), size=2) +
theme(axis.text.x=element_text(angle=45, hjust=1)) +
scale_x_discrete(breaks = unique(solar$date)) +
ylim(0,600) +
theme(legend.position="top") +
labs(x="Quarter", y="Amount", fill="") +
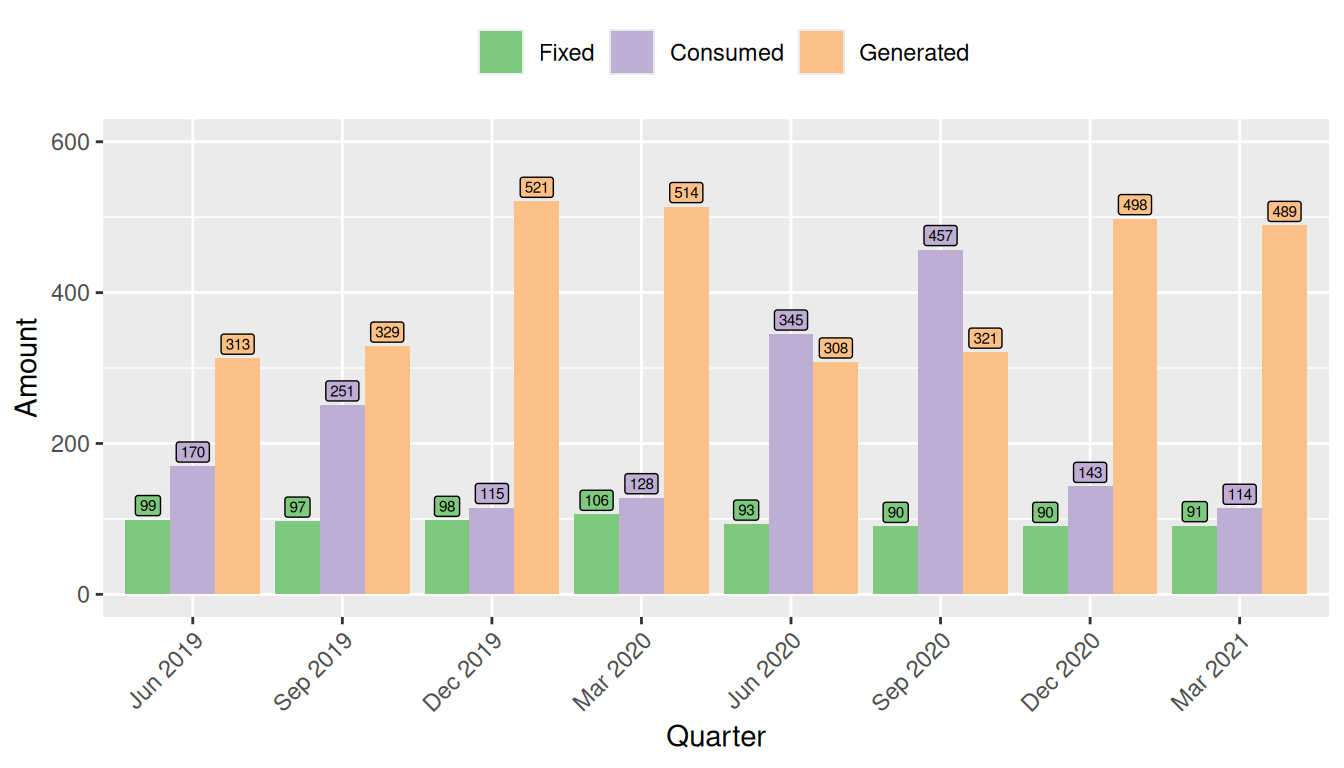
scale_fill_brewer(palette="Accent")The solar dataset records 8 quarterly observations of the amount of
electricity generated by solar photovoltaic panels, the amount
consumed by the household, and a fixed overhead:
## Rows: 24
## Columns: 3
## $ date   <ord> Jun 2019, Jun 2019, Jun 2019, Sep 2019, Sep 2019, Sep 2019, Dec…
## $ item   <ord> Fixed, Consumed, Generated, Fixed, Consumed, Generated, Fixed, …
## $ amount <dbl> 99, 170, 313, 97, 251, 329, 98, 115, 521, 106, 128, 514, 93, 34…
Exercise: plot Fixed and Consumed as a single stacked bar placed beside the Generated bar.
Your donation will support ongoing availability and give you access to the PDF version of this book. Desktop Survival Guides include Data Science, GNU/Linux, and MLHub. Books available on Amazon include Data Mining with Rattle and Essentials of Data Science. Popular open source software includes rattle, wajig, and mlhub. Hosted by Togaware, a pioneer of free and open source software since 1984. Copyright © 1995-2022 Graham.Williams@togaware.com Creative Commons Attribution-ShareAlike 4.0
