11.18 Bar Chart Stacked
20210413
ds %>%
ggplot(aes(x=wind_dir_3pm, fill=rain_tomorrow)) +
geom_bar() +
scale_y_continuous(labels=comma) +
labs(x=vnames["wind_dir_3pm"], y="Count") +
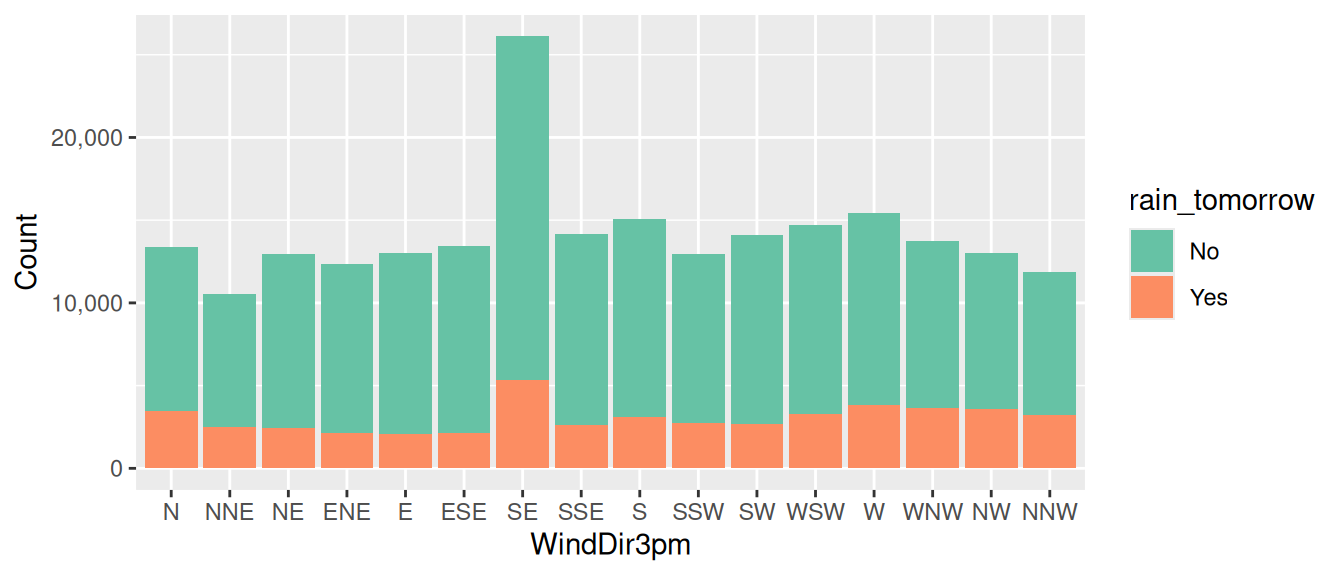
scale_fill_brewer(palette="Set2")A stacked bar chart shows a breakdown of the values in the bars based
on another variable. It is achieved by adding fill=rain_tomorrow to
the basic bar chart of Section ??.
An issue with stacked bar charts is that whilst the bottom bars are easy to compare bar by bar, the tops are difficult to compare since they all start from a different baseline. A good alternative is to have both bars in a column but side-by-side, as in Section 11.7.
Your donation will support ongoing availability and give you access to the PDF version of this book. Desktop Survival Guides include Data Science, GNU/Linux, and MLHub. Books available on Amazon include Data Mining with Rattle and Essentials of Data Science. Popular open source software includes rattle, wajig, and mlhub. Hosted by Togaware, a pioneer of free and open source software since 1984. Copyright © 1995-2022 Graham.Williams@togaware.com Creative Commons Attribution-ShareAlike 4.0
