28.25 Adding a Flowchart
REVIEW LaTeX and R both support extensive
capability for generating pictures. Here we use the (Soetaert 2020)
package to draw a flow chart, something that is a common requirement
in documentation. The simple example shows the process of converting a
.Rnw file using knitr (Xie 2025) to a LaTeX file which can
then be processed by pdflatex to generate the .pdf file. The
result can be seen in Figure @ref(fig:knitr:knitr_diagram_flowchart).
# Load package from the local library into the R session.

library(diagram)

# Identify some names for the nodes of the flowchart.

names   <- c(".Rnw", ".tex", ".pdf")

# Set up the connectivity data.

connect <- c(0,       0,          0,
             "knitr", 0,          0,
             0,       "pdflatex", 0)

# Constract a connectivity matrix and plot the flowchart.

matrix(nrow=3, ncol=3, byrow=TRUE, data=connect) %>%
  plotmat(pos=c(1, 2), name=names, box.col="orange")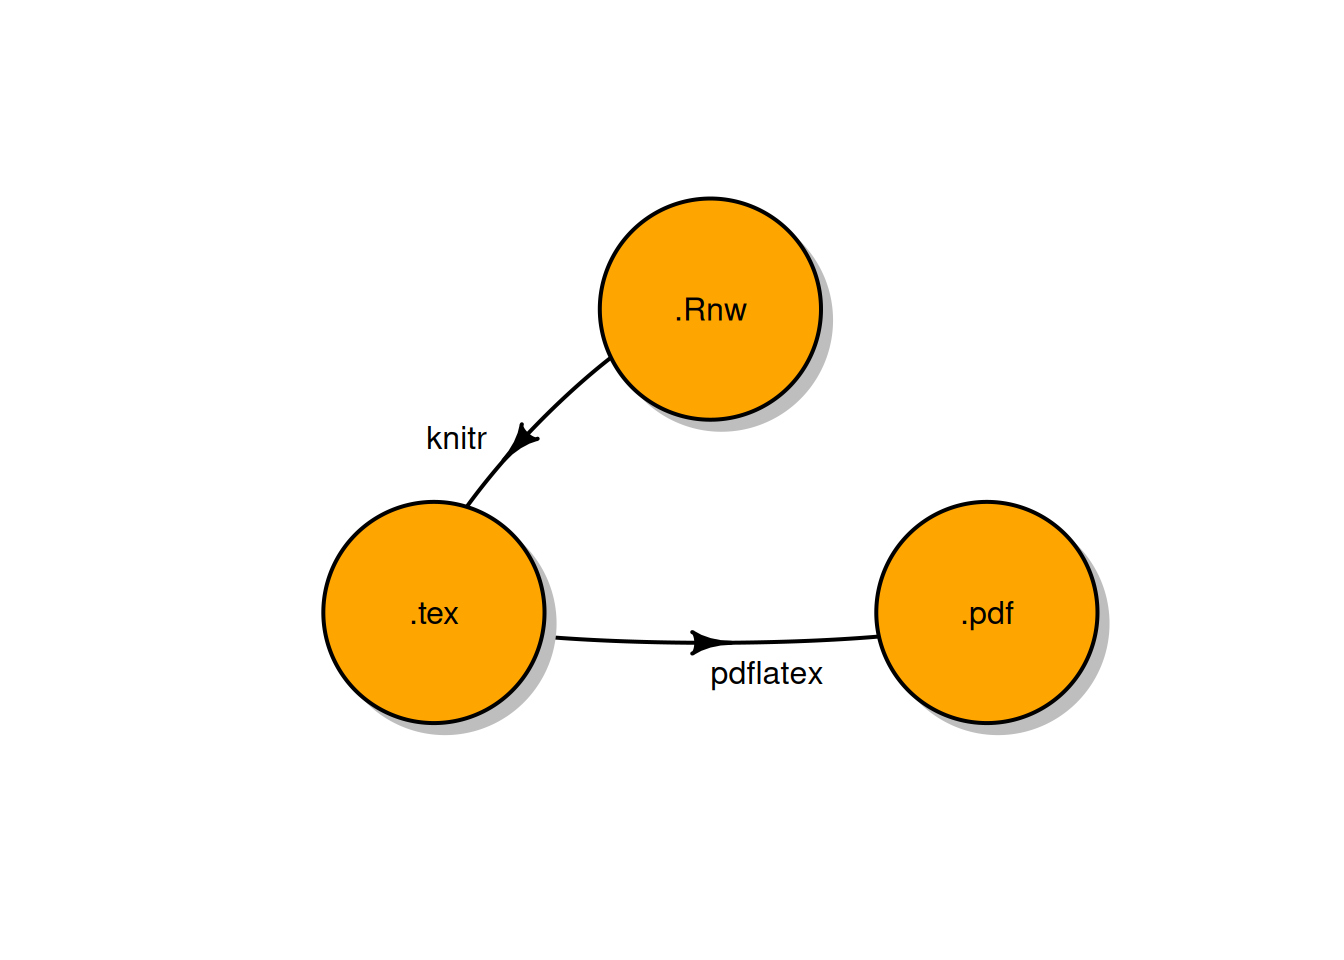
(#fig:knitr:knitr_diagram_flowchart)The knitr process to generate a pdf.
There are many more possibilities provided by
diagram (Soetaert 2020) and if interested you can explore
demo(plotmat) and demo(plotweb).
References
Soetaert, Karline. 2020. Diagram: Functions for Visualising Simple Graphs (Networks), Plotting Flow Diagrams. https://doi.org/10.32614/CRAN.package.diagram.
———. 2025. Knitr: A General-Purpose Package for Dynamic Report Generation in r. https://yihui.org/knitr/.
Your donation will support ongoing availability and give you access to the PDF version of this book. Desktop Survival Guides include Data Science, GNU/Linux, and MLHub. Books available on Amazon include Data Mining with Rattle and Essentials of Data Science. Popular open source software includes rattle, wajig, and mlhub. Hosted by Togaware, a pioneer of free and open source software since 1984. Copyright © 1995-2022 Graham.Williams@togaware.com Creative Commons Attribution-ShareAlike 4.0
