11.34 Faceted Location Thin Lines
20200608
## Warning: Using `size` aesthetic for lines was deprecated in ggplot2 3.4.0.
## ℹ Please use `linewidth` instead.
## This warning is displayed once every 8 hours.
## Call `lifecycle::last_lifecycle_warnings()` to see where this warning was generated.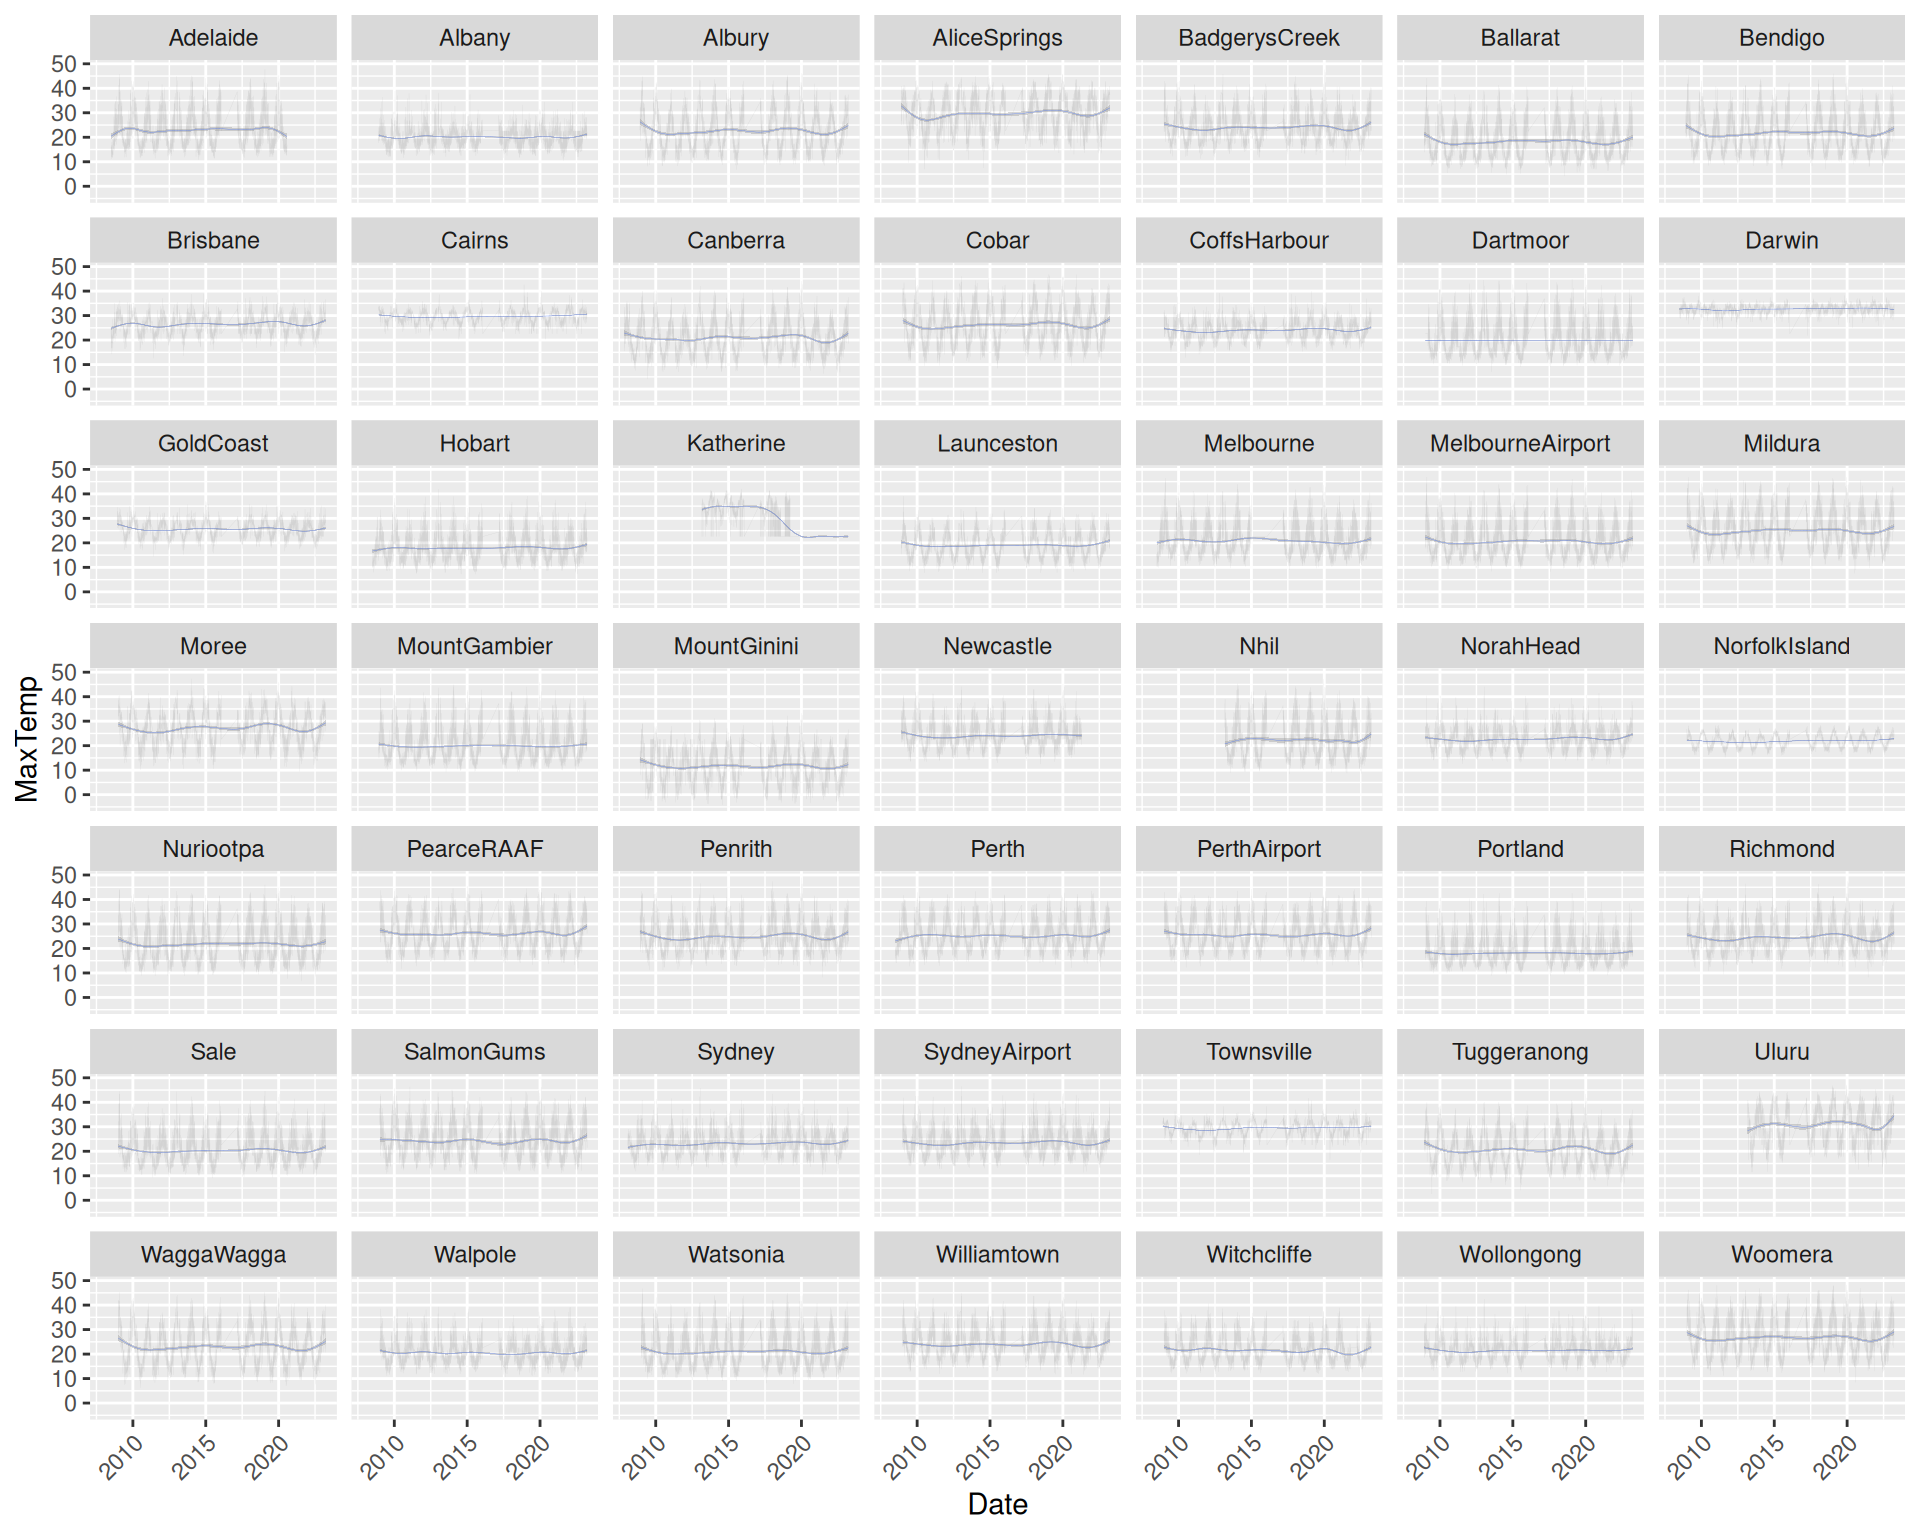
ds %>%
  ggplot(aes(x=date, y=max_temp)) +
  geom_line(alpha=0.1, size=0.05) +
  geom_smooth(method="gam", formula=y~s(x, bs="cs"), size=0.05) +
  facet_wrap(~location) +
  theme(axis.text.x=element_text(angle=45, hjust=1)) +
  labs(x=vnames["date"], y=vnames["max_temp"])
An alternative is to present the plot as a line chart rather than a scatter plot. It does make more sense for a time series plot such as this, though the effect is little changed due to the amount of data being displayed.
Changing to lines simply uses ggplot2::geom_line() instead of ggplot2::geom_point(). Very thin lines are used as specified through the size= option. Nonetheless, the data remains quite dense.
Your donation will support ongoing availability and give you access to the PDF version of this book. Desktop Survival Guides include Data Science, GNU/Linux, and MLHub. Books available on Amazon include Data Mining with Rattle and Essentials of Data Science. Popular open source software includes rattle, wajig, and mlhub. Hosted by Togaware, a pioneer of free and open source software since 1984. Copyright © 1995-2022 Graham.Williams@togaware.com Creative Commons Attribution-ShareAlike 4.0
