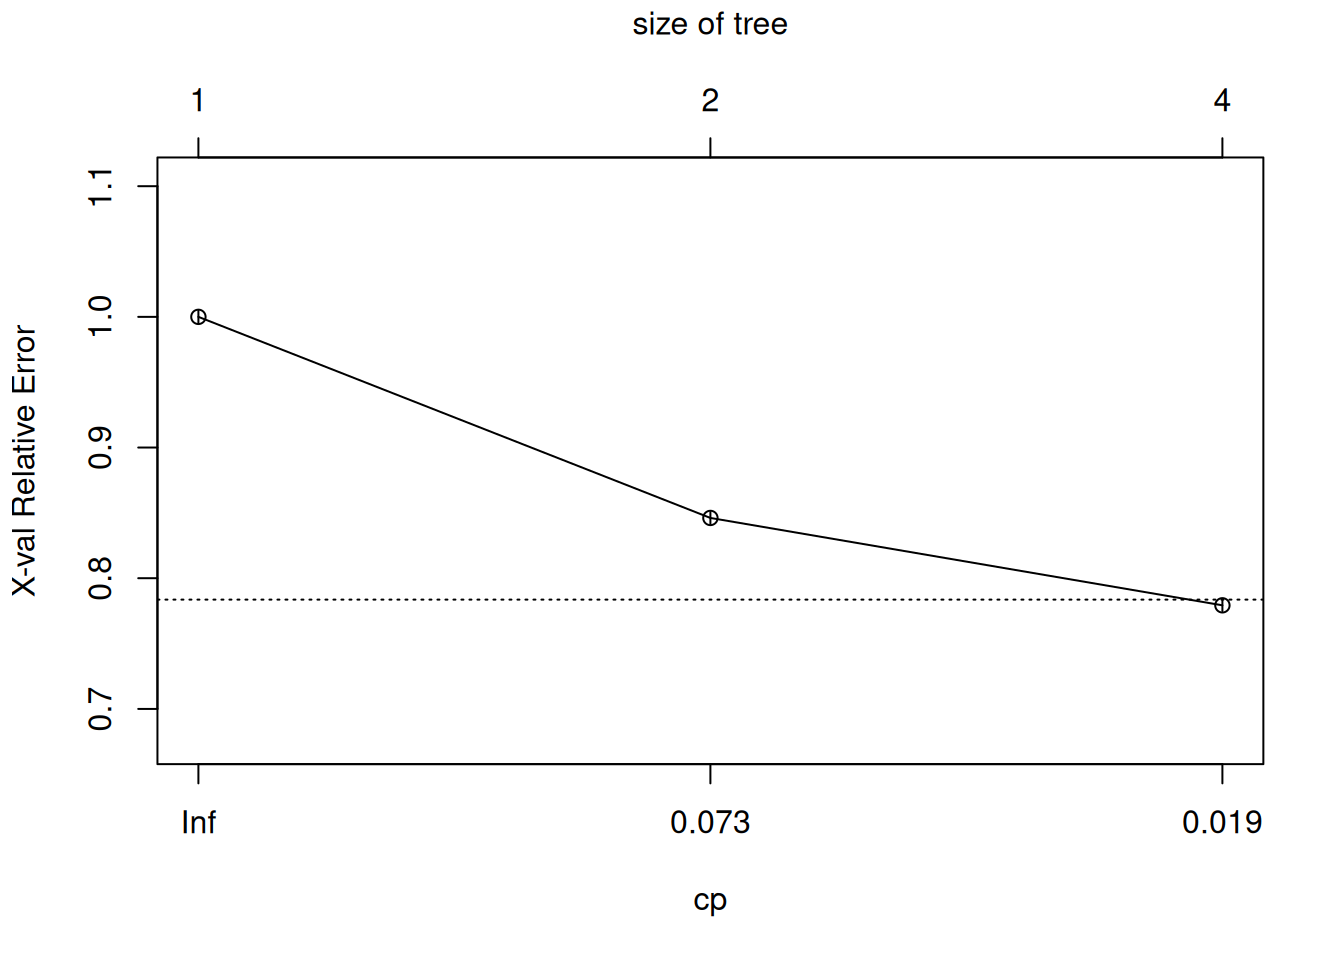
20.19 Complexity Parameter Plot
The rpart::plotcp() plots the cross-validation results. Here we see a set of possible cost-complexity prunings of the tree. We might choose to prune using the leftmost complexity parameter which has a mean below the horizontal line.
Your donation will support ongoing availability and give you access to the PDF version of this book. Desktop Survival Guides include Data Science, GNU/Linux, and MLHub. Books available on Amazon include Data Mining with Rattle and Essentials of Data Science. Popular open source software includes rattle, wajig, and mlhub. Hosted by Togaware, a pioneer of free and open source software since 1984. Copyright © 1995-2022 Graham.Williams@togaware.com Creative Commons Attribution-ShareAlike 4.0
