28.20 Adjusting Aspect
REVIEW
# Load packages from the local library into the R session.

library(rattle)   # For the weatherAUS dataset.
library(ggplot2)  # To generate a density plot.

# Identify cities of interest.

cities <- c("Canberra", "Darwin", "Melbourne", "Sydney")

# Generate the plot.

weatherAUS %>%
  subset(Location %in% cities & ! is.na(Temp3pm)) %>%
  ggplot(aes(x=Temp3pm, colour=Location, fill=Location)) +
  geom_density(alpha=0.55)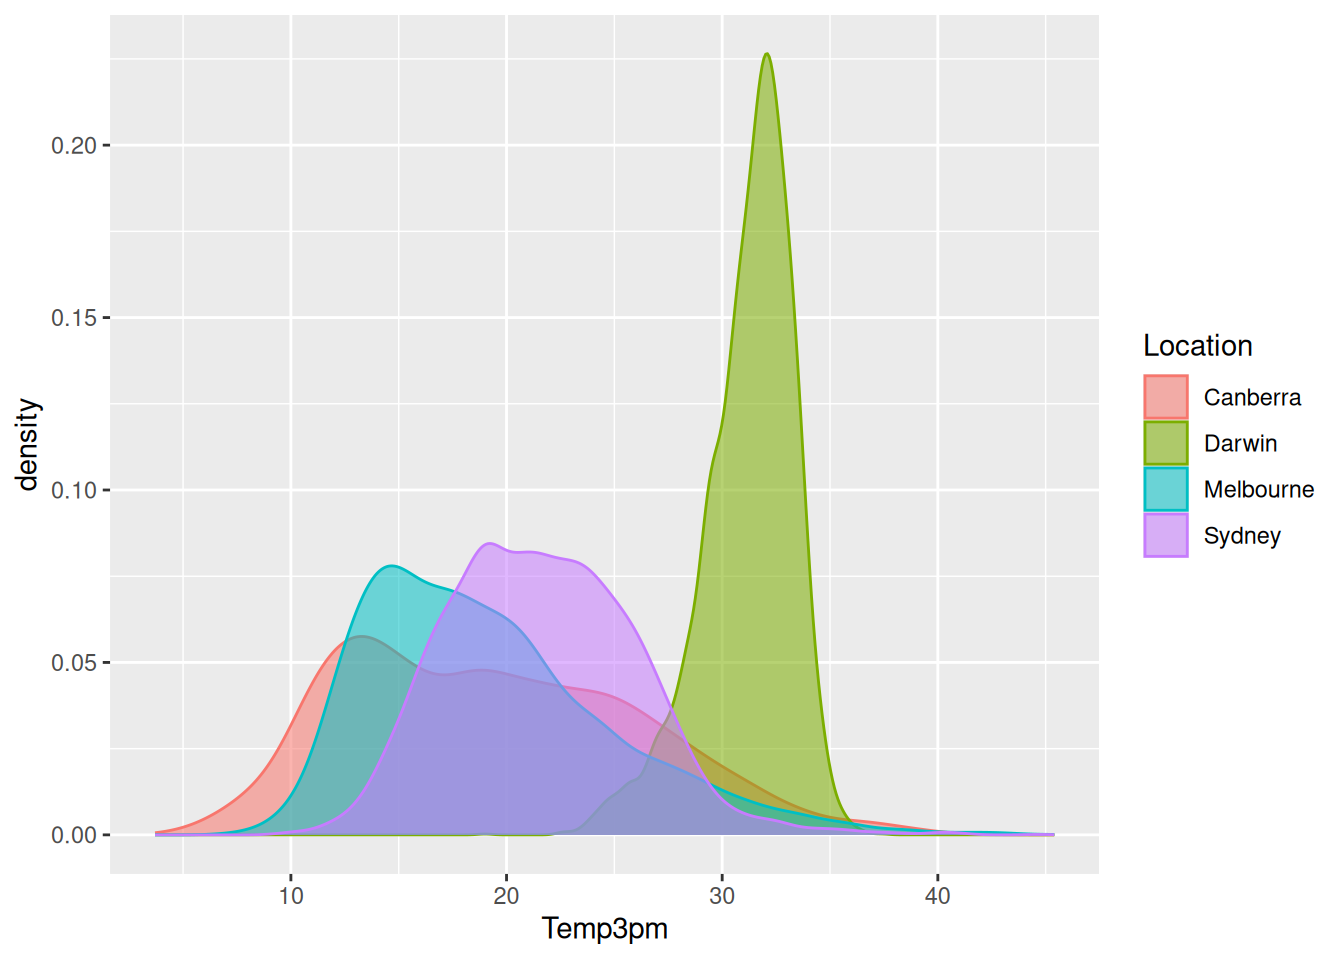
We can fine tune the size of the figure to suit the document and presentation. In this example we have asked R to widen the figure from 7 inches to 14 inches using fig.width=. The code chunk is:
Underneath, knitr (Xie 2025) is using a PDF device on which the plot
is generated, and then saved to file for inclusion in the final
document. The PDF device grDevices::pdf(), by default, will generate
a 7 inch by 7 inch plot (see ?pdf for details). This is the
plot dimensions as we see on the previous page. By setting
fig.width= (and fig.height=) we can change the
dimensions. In our example here we have doubled the width, resulting
in a more pleasing plot.
Notice that as a consequence of the figure being larger the fonts have remained the same size, resulting them appearing smaller now when we include the figure in the same area on the printed page.
References
Your donation will support ongoing availability and give you access to the PDF version of this book. Desktop Survival Guides include Data Science, GNU/Linux, and MLHub. Books available on Amazon include Data Mining with Rattle and Essentials of Data Science. Popular open source software includes rattle, wajig, and mlhub. Hosted by Togaware, a pioneer of free and open source software since 1984. Copyright © 1995-2022 Graham.Williams@togaware.com Creative Commons Attribution-ShareAlike 4.0
