11.31 Labels with Dates
20210720
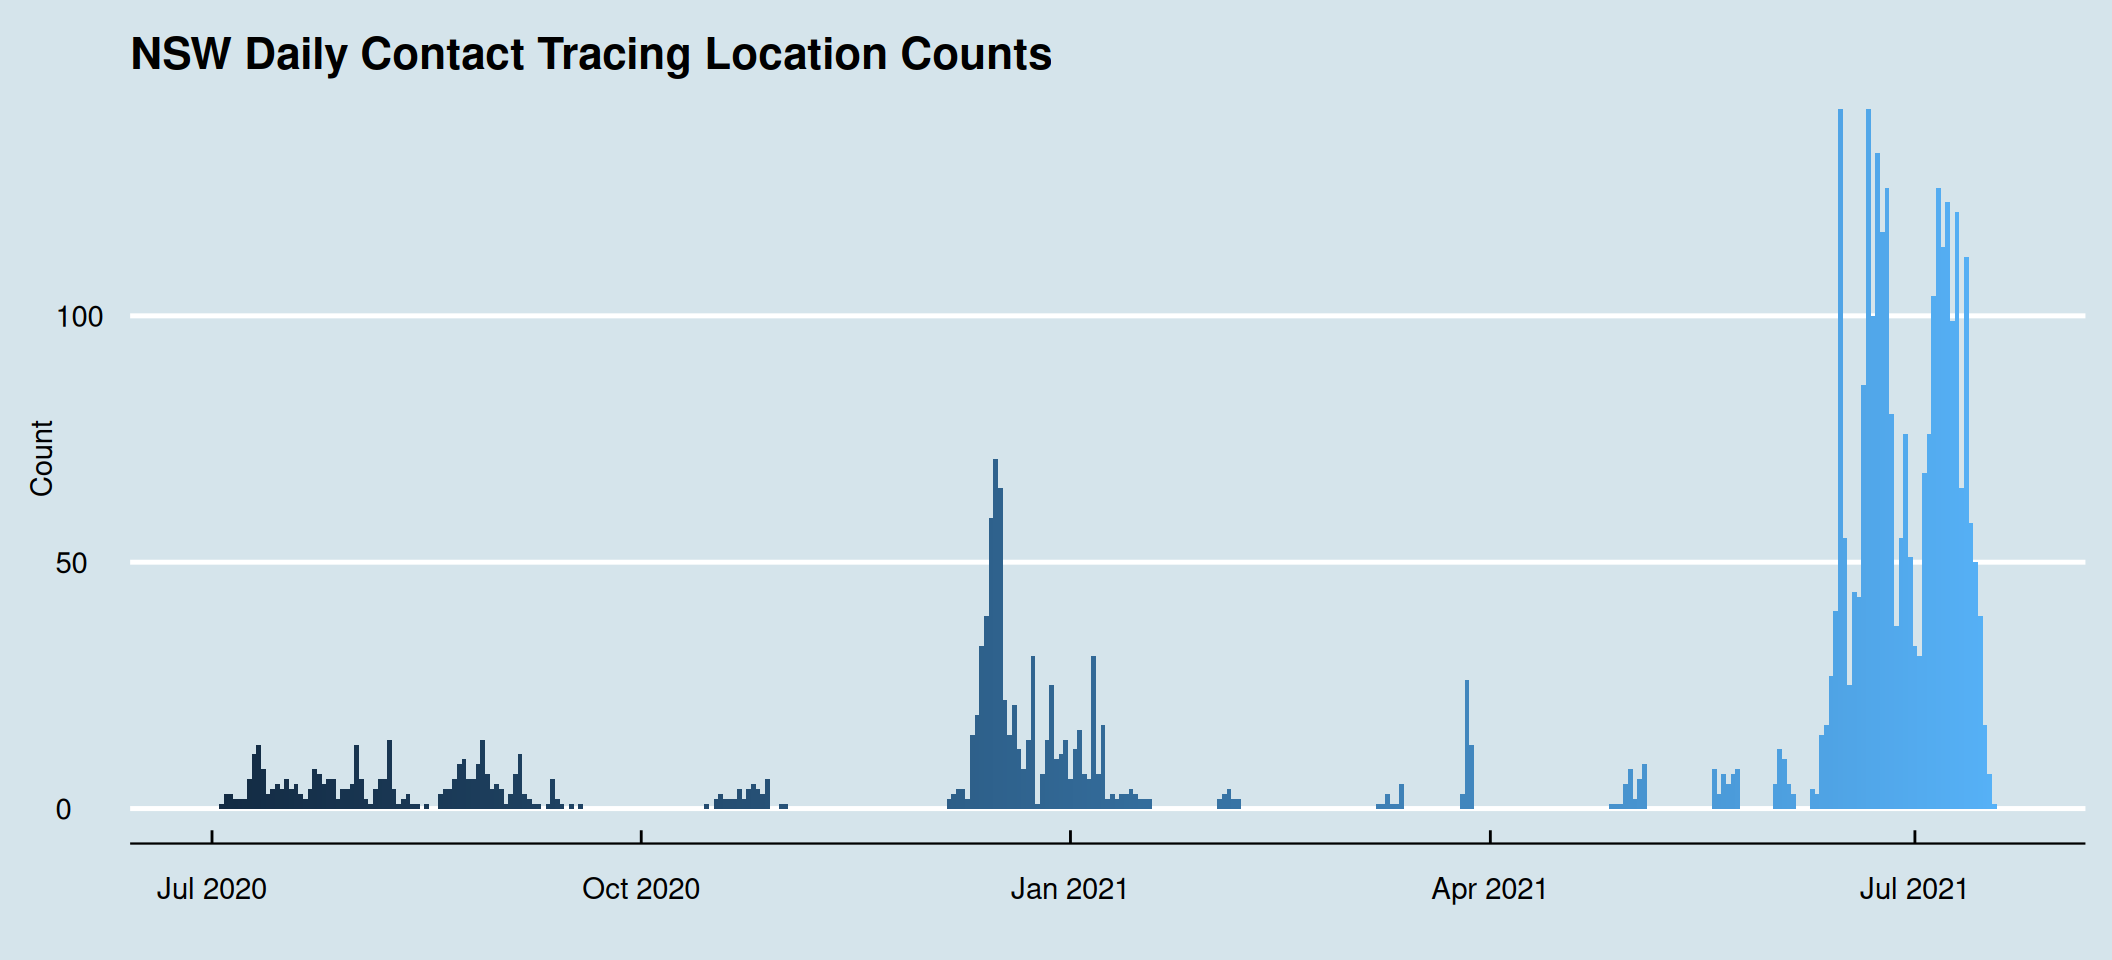
readr::read_csv("data/covid_contact_locations.csv", col_names=c("state", "date", "count")) %>%
  dplyr::filter(state == "NSW") %>%
  ggplot(aes(x=date, y=count, fill=date)) +
  geom_col(width=1) +
  labs(x="Date", y="Count", title="NSW Daily Contact Tracing Location Counts") +
  ggthemes::theme_economist() +
  theme(legend.position="none") +
  scale_x_date(date_labels="%b %Y")
Use ggplot2::scale_x_date() with date_labels="%b %Y" to plot
Month Year on the x-axis. The sample dataset here is a COVID-19
contact tracing location dataset, counting the number of new contact
tracing locations reported for particular dates in New South Wales,
Australia. The data is loaded using readr::read_csv() from a
csv file without a header row so we provide col_names=.
Your donation will support ongoing development and give you access to the PDF version of this book. Desktop Survival Guides include Data Science, GNU/Linux, and MLHub. Books available on Amazon include Data Mining with Rattle and Essentials of Data Science. Popular open source software includes rattle, wajig, and mlhub. Hosted by Togaware, a pioneer of free and open source software since 1984.
Copyright © 1995-2021 Graham.Williams@togaware.com Creative Commons Attribution-ShareAlike 4.0.