20.74 C5.0 Rules Performance
Here we plot the performance of the decision tree, showing a risk chart. The areas under the recall and risk curves are also reported.
predicted <- predict(model, ds[te, vars], type="prob")[,2]
riskchart(predicted, actual_te, risk_te)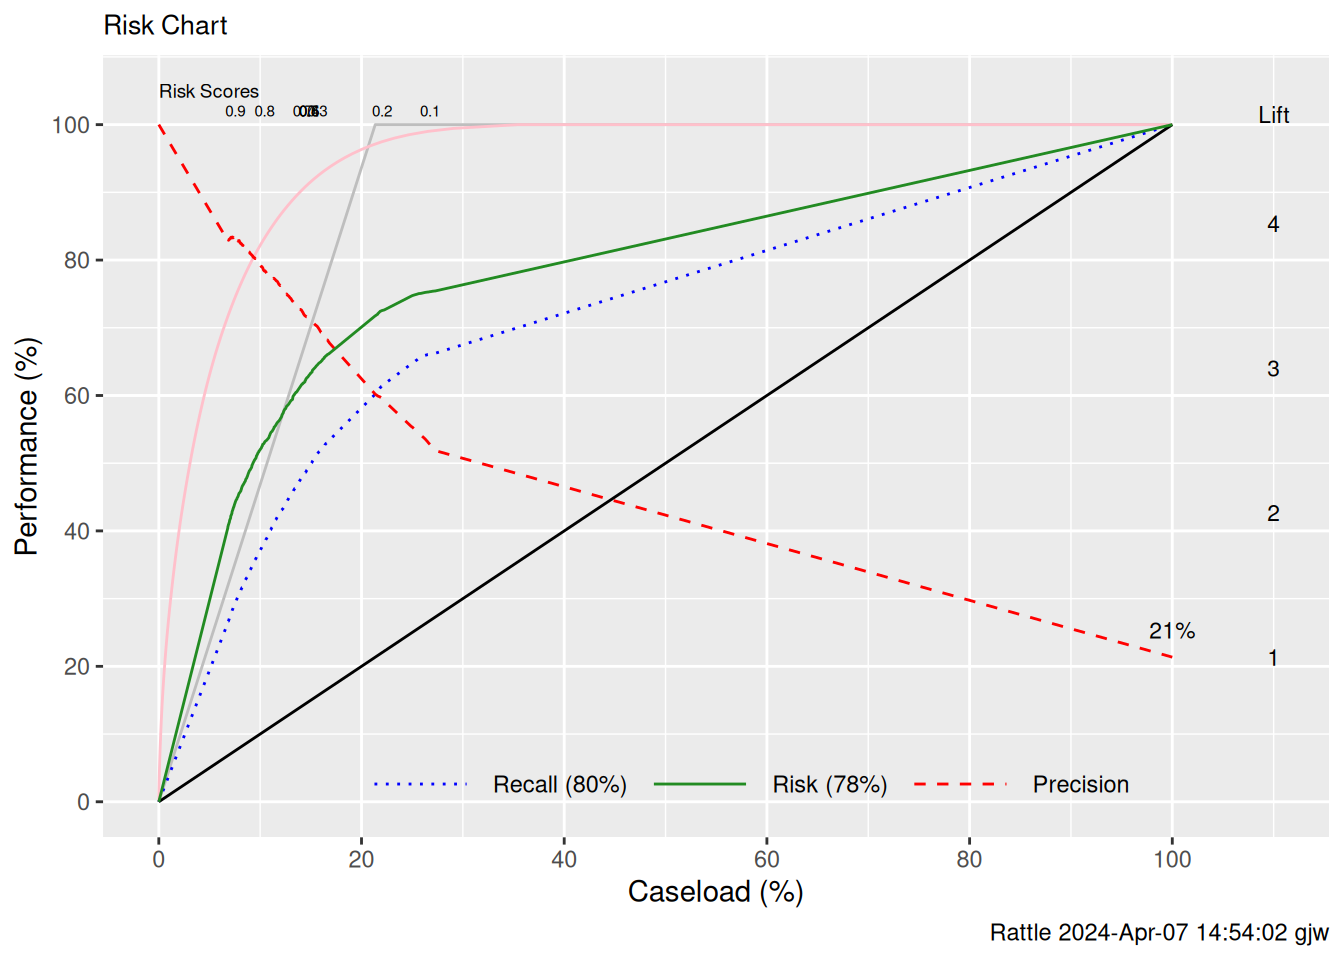
An error matrix shows, clockwise from the top left, the percentages of true negatives, false positives, true positives, and false negatives.
predicted <- predict(model, ds[te, vars], type="class")
sum(ds[te, target] != predicted)/length(predicted) # Overall error rate
round(100*table(ds[te, target], predicted, dnn=c("Actual", "Predicted"))/length(predicted))
Your donation will support ongoing development and give you access to the PDF version of this book. Desktop Survival Guides include Data Science, GNU/Linux, and MLHub. Books available on Amazon include Data Mining with Rattle and Essentials of Data Science. Popular open source software includes rattle, wajig, and mlhub. Hosted by Togaware, a pioneer of free and open source software since 1984.
Copyright © 1995-2021 Graham.Williams@togaware.com Creative Commons Attribution-ShareAlike 4.0.