7.16 kmeans example wine clusters
20220316
In Sections 7.14 and 7.15 we saw a clustering of a dataset with very differently scaled numeric variables. Yet, on first observation the resulting plot for the non-normalised dataset, from Section 7.14 and reproduced on the left below, pleasingly separates the clusters on the first principle component. After normalising the data in Section 7.15 the plot on the right below results, with more dispersion of the clusters.
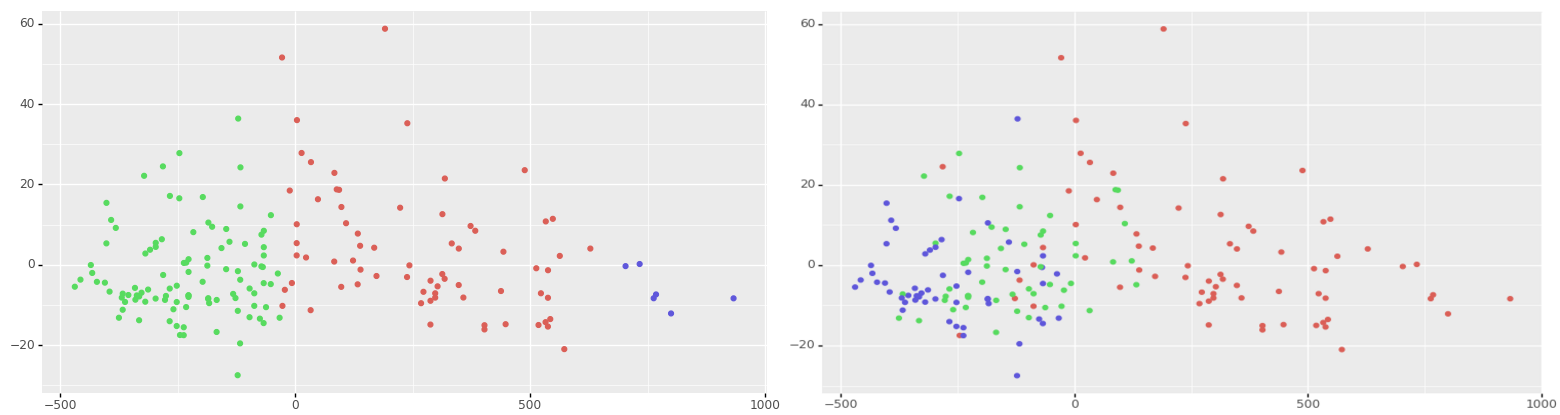
Exercise: Explain why the clustering of the non-normalised dataset appears well separated with respect to the first principle component, and yet for what is claimed should be a better clustering after the data is normalised the separation is not at all pronounced.
Your donation will support ongoing availability and give you access to the PDF version of this book. Desktop Survival Guides include Data Science, GNU/Linux, and MLHub. Books available on Amazon include Data Mining with Rattle and Essentials of Data Science. Popular open source software includes rattle, wajig, and mlhub. Hosted by Togaware, a pioneer of free and open source software since 1984. Copyright © 1995-2022 Graham.Williams@togaware.com Creative Commons Attribution-ShareAlike 4.0