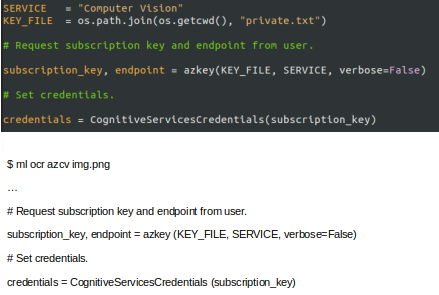
12.16 azcv ocr programming code
Imagine the use case where we may have access to an image of some programming code and want to recover that code to include it into an actual program, without manually re-typing it. We can again use OCR. Here the bounding boxes have been filtered out and just the code is shown.
20210316
We can use OCR to extract programming code from photos of the code. Here we demonstrate extracting text from an image of code written in Python, as exposed through the MLHub package azcv.
If all you have is an image of some code but would like to replicate the code without retyping it all, here’s an approach. The following image (probably from a screenshot) was posted by Emily Klarquist on Twitter, 20 May 2019. Below is the extracted code, which is pretty close but not perfect by any means. A model tuned to extracting code would be more useful here. For now we need to do some post extraction manual processing. For python code, for example, we may need to use the bounding box information to guide indentation as the following step in the pipeline. Of course a decent IDE will also assist with indenting the extracted code.

7.0 19.0 167.0 18.0 168.0 35.0 8.0 36.0,require (ggplot2)
8.0 62.0 1118.0 61.0 1118.0 83.0 9.0 84.0,nobel_winners <- read. csv ("https://raw. githubusercontent . com/rfordatascience/tidytuesday/master/data/2019/2019-05
12.0 85.0 236.0 86.0 235.0 104.0 11.0 103.0,-14/nobel_winners . csv")
6.0 146.0 1013.0 145.0 1014.0 168.0 7.0 169.0,nobel_winners$birth_year <- substring (nobel_winners$birth_date, 1, 4) #pulling year out of the birthdate
8.0 209.0 955.0 208.0 956.0 228.0 9.0 229.0,nobel_winners$birth_year <- as . integer (nobel_winners$birth_year) #changing birth year to integer
7.0 269.0 1034.0 268.0 1035.0 290.0 8.0 291.0,nobel_winners$award_age <- (nobel_winners$prize_year - nobel_winners$birth_year) #creating the award age
10.0 330.0 771.0 329.0 772.0 351.0 11.0 352.0,#ggplot (nobel_winners, aes (x=prize_year, y=award age) ) + #making a basic plot
30.0 356.0 158.0 355.0 159.0 372.0 31.0 373.0,#geom point ()
9.0 414.0 1120.0 413.0 1120.0 434.0 10.0 436.0,nobel_winners$category <- ordered (nobel_winners$category, levels = c("Medicine", "Physics", "Chemistry", "Economics"
13.0 437.0 503.0 437.0 502.0 457.0 12.0 456.0,, "Literature", "Peace") ) #reordering the categories
9.0 459.0 303.0 460.0 302.0 481.0 8.0 479.0,levels (nobel_winners$category)
10.0 521.0 181.0 519.0 182.0 540.0 11.0 542.0,## [1] "Medicine"
207.0 519.0 301.0 520.0 300.0 540.0 206.0 539.0,"Physics"
329.0 520.0 708.0 520.0 707.0 540.0 328.0 539.0,"Chemistry" "Economics" "Literature"
12.0 543.0 147.0 544.0 146.0 562.0 11.0 561.0,## [6] "Peace"
6.0 605.0 1120.0 604.0 1121.0 625.0 7.0 626.0,levels (nobel_winners$category) <- c ("Medicine", "Physics", "Chemistry", "Economics*", "Literature", "Peace") #to chang
10.0 628.0 155.0 629.0 154.0 648.0 9.0 647.0,e facet titles
12.0 688.0 798.0 689.0 797.0 711.0 11.0 710.0,chart <- ggplot (nobel_winners, aes (x=prize_year, y=award_age, color=category) ) +
28.0 713.0 315.0 712.0 316.0 732.0 29.0 734.0,geom_point (shape=1, size = 1)
30.0 734.0 448.0 734.0 448.0 755.0 31.0 755.0,chart + facet_grid (cols = vars (category) ) +
30.0 757.0 545.0 756.0 545.0 776.0 31.0 778.0,geom_smooth (aes (color=category) , se=FALSE, 1wd=1.5) +
30.0 779.0 1118.0 780.0 1118.0 800.0 29.0 799.0,labs (title = 'Senescience', subtitle = 'Age of Nobel laureates, at date of award', caption = 'Source: Nobelpri
11.0 804.0 74.0 805.0 74.0 824.0 10.0 822.0,ze . org
861.0 801.0 1120.0 801.0 1120.0 822.0 862.0 822.0,* the economics prize was f
10.0 825.0 711.0 826.0 710.0 845.0 9.0 844.0,irst awarded in 1969' ) + #add titles, not sure how to add two captions
49.0 870.0 1120.0 869.0 1121.0 890.0 50.0 891.0,theme (plot . title = element_text (face = "bold"), legend. position = "none", strip. text. x = element_text (angle =
22.0 892.0 1121.0 891.0 1122.0 912.0 23.0 913.0,0, hjust=0, face="bold", color = c("#014d64", "#90353B", "#EE6A50", "#2D6D66", "#EE9A00", "#01A209") ) ) + #attempt at
22.0 916.0 250.0 914.0 251.0 934.0 23.0 935.0,changing x facet titles
53.0 937.0 779.0 938.0 779.0 959.0 52.0 958.0,theme (plot . caption = element_text (hjust = 0, size = 9) ) + #moving caption
27.0 959.0 1118.0 959.0 1119.0 980.0 28.0 980.0,scale_x_continuous (name= "", breaks= c (1900, 1925, 1950, 1975, 2000) , labels=c (1900, "",50, "", 2000), limits=c (1900, 2
12.0 981.0 306.0 982.0 305.0 1003.0 11.0 1002.0,025) ) + #edit x axis and breaks
33.0 1005.0 1120.0 1004.0 1120.0 1026.0 34.0 1027.0,scale_y_continuous (name="", breaks=c (25, 50, 75, 100) , labels=c (25, 50, 75, 100), position = "right", 25, limits=c(15
10.0 1029.0 98.0 1027.0 98.0 1047.0 11.0 1050.0,, 101) ) +
50.0 1051.0 1092.0 1050.0 1093.0 1071.0 51.0 1072.0,theme (panel . grid. major. x = element_blank (), panel. grid. minor. x = element_blank () , ) + #edit y axis and grid
42.0 1073.0 1080.0 1072.0 1081.0 1092.0 43.0 1093.0,scale_colour_manual (values=c ("#014d64", "#90353B", "#EE6A50", "#2D6066", "#EE9A00", "#01A209") ) + #manual color
48.0 1096.0 1106.0 1094.0 1107.0 1116.0 49.0 1117.0,annotate ("text", x= Inf, y= 96, label = "Oldest winner \n Leonid Hurwicz, 90", hjust = 1, size = 2.5, colour
37.0 1119.0 750.0 1117.0 751.0 1139.0 38.0 1141.0,c ("grey92", "grey92", "grey92", "#2D6066", "grey92", "grey92") ) + #add Oldest
47.0 1141.0 1117.0 1140.0 1118.0 1161.0 48.0 1162.0,annotate ("text", x= Inf, y= 25, label = "Youngest winner \n Malala Yousafzai, 17", hjust = 1, size = 2.5, col
11.0 1163.0 779.0 1162.0 780.0 1184.0 12.0 1185.0,our = c ("grey92", "grey92", "grey92", "grey92", "grey92", "#01A209") ) #add youngest
Your donation will support ongoing availability and give you access to the PDF version of this book. Desktop Survival Guides include Data Science, GNU/Linux, and MLHub. Books available on Amazon include Data Mining with Rattle and Essentials of Data Science. Popular open source software includes rattle, wajig, and mlhub. Hosted by Togaware, a pioneer of free and open source software since 1984. Copyright © 1995-2022 Graham.Williams@togaware.com Creative Commons Attribution-ShareAlike 4.0